The Joy of Mapping by Oliver Ashton

 The first mind maps I used were to visualise scripts in story boards which allowed me to translate concepts, scenes, shots, costume and make-up into pictures that could be understood in multi departmental environments, through different production processes, across entire project life cycles. When I moved over to interactive gaming it was second nature to interpret interactive TV WEB gaming projects through visual methodology to understand the IT, to create the customer experience and to develop the brand and marketing from concept stage. I started brainstorming visual networks which allowed me to focus on the planning as well as the creative aspects of the project across everything from the studio and user interfaces design to the IT development and integration in one a single vision.
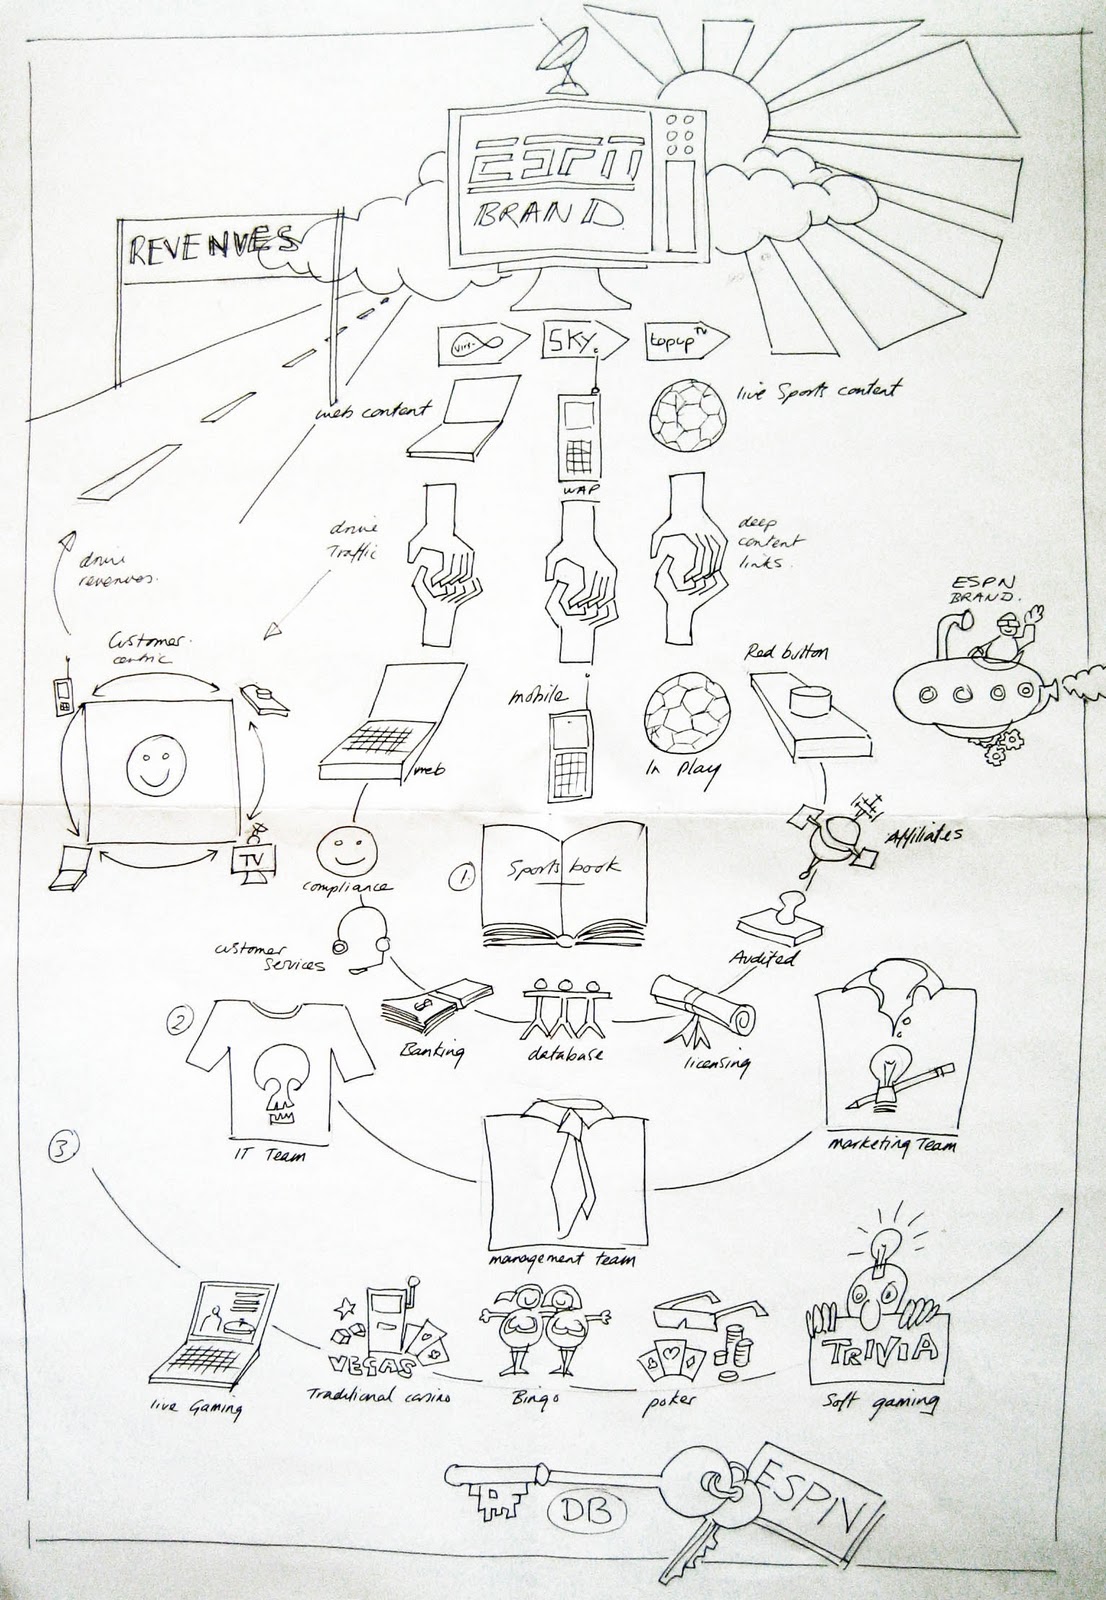
 I discovered that you can map any concept across any channel, including Digital, Interactive, Social, Marketing, Engagement, Banking, TV, WEB, MOB and any sub heading that these headings network too, including budgets, stats and commerce. Where pictorial representations become useful is in understanding virtual spaces which exist outside our immediate vision, but which are firmly integrated into our digital business practices. Once I understood this concept then I could map any environment to better understand how technology, business, content, media, IT and marketing interact.

Visual maps enhance idea processes and brainstorming exercises and are a wonderful approach to project planning from concept. They demystify unknown spaces and allow every department to be involved and locate themselves on complex shared projects. I would also argue that visual mapping is essential to help clients understand digital spaces such as social, buzz monitoring, traffic flow and how digital then integrates with offline business models to create homogenised, symbiotic strategy. In this way mapping acts as an educational tool, opens up more inclusive practices and pushes the boundaries to transcend traditional marketing and business practices.
 Visual mapping is a ‘problem solving’ methodology that can simultaneously translate complex digit business models and offer an overview without extensive explanation. I personally use visual mapping to show clients how to launch platforms as part of an integrated business strategy, to drive traffic to ecommerce and data collection solutions and to devise new online business ideas that reveal product access points into existing markets. Best of all I can finally reveal customer centric engagement models in interactive social spaces, based on content, supported by deep content links, in order to drive traffic to a variety of payment solution.
  Once you start visual mapping there is no limit to how one can condense ideas, solutions and links into memorable symbols. For me the best existing application of visual mapping is the iPhone interface which is leading innovative technology through simple pictorial signs that link seamlessly through to desired applications. My favourite historical mind map though, was produced by the electrical draughtsman, Harry Beck, who created a stunningly simple design back in 1933 to navigate the London tube network which was an unseen, underground space, viewed by travellers with suspicion until it was demystified by the Tube Map we still read today.
 I was influenced by Harry Beck when I designed a roulette IVR system [ an ‘inbound calling system’ to you and I] as a gaming, call centre and banking solution which eventually covered over 100 operations in ten touch phone digits. The system had to be quick to play to get the bets on but the solution still existed in a sub electronic telephone server world which no one could see and would take weeks to learn. The answer was a simple visual Tube Map that could be read at a glance and which meant that players quickly learnt number combinations for quicker gaming.
Right: Live IPTV broadcast schematics
Right: Live IPTV broadcast schematics
Below: IVR Games and depositing Map


I was recently asked to map the plan of a new safety feature for a Webster Bennett Core Boring machine, again I used a simple colour coding system to underline the design features and the architecture of the schematics for the engineer, the operator and the safety council to understand. I am not often asked to design 'heavy machine safety systems' but it was an interesting challenge offered to me by my father who is an engineer. This high lights the way visual mapping can be used in logical schematics used in shared environments from design concept to end user.
The brief stated that the drill operator had to stand outside of the machine area when the machine was in operation and that the machinery could not operate unless both a magnetic lock and a door sensor were shown to be in use. To guarantee these safety features the operator had to press a 'Sensor' and a 'Magnetic Lock' button in sequence before the green 'Start' button would light up, which once also pressed allowed the hydraulic fluids to flow.
 The map above was created for Live Casino Technology to illustrate the live casino white label service on offer to B2B customers. The diagram shows the studio and live dealer services on the left and the integration and business proposition on the right. Explanation of all three areas can be complicated as can the integration process but through visualisation I was able to show every aspect at a glance whilst underlining the fact that the platform was reassuringly organised and simple to integrate with.
